File:Global Temperature And Forces With Fahrenheit.svg

Original file (SVG file, nominally 960 × 720 pixels, file size: 51 KB)
Summary
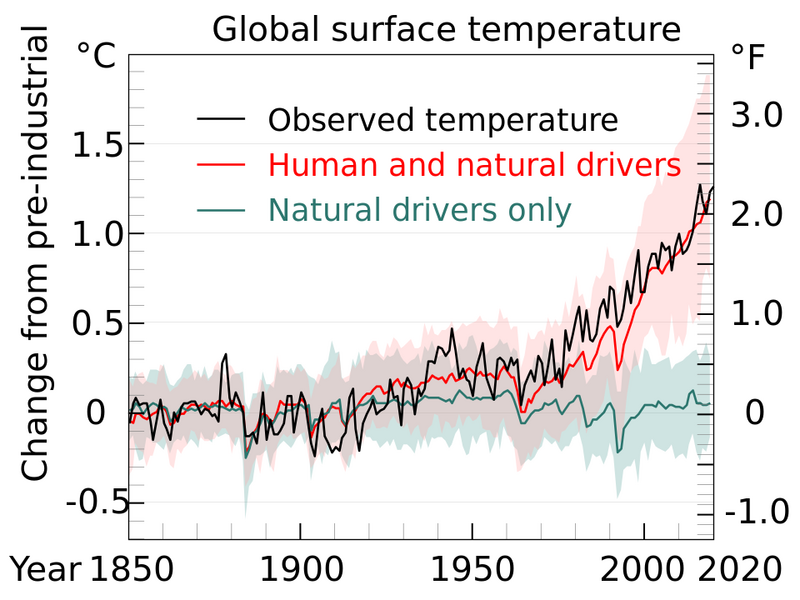
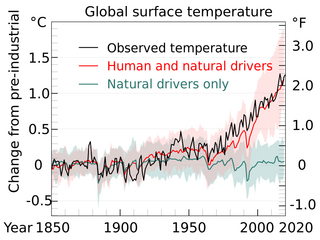
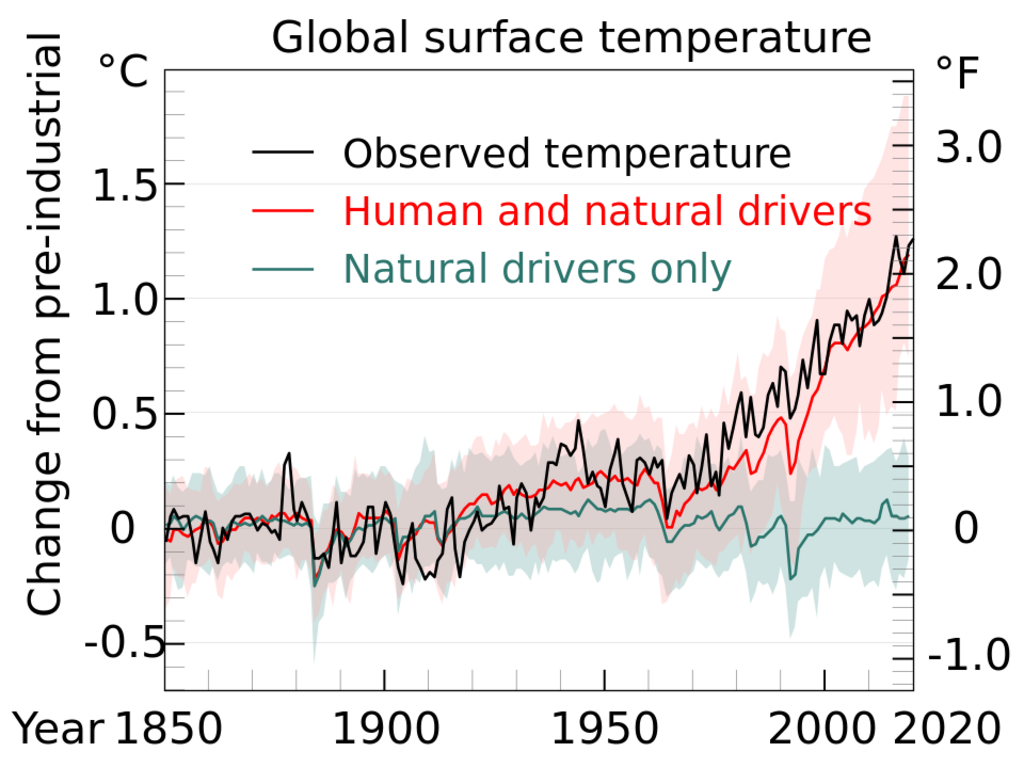
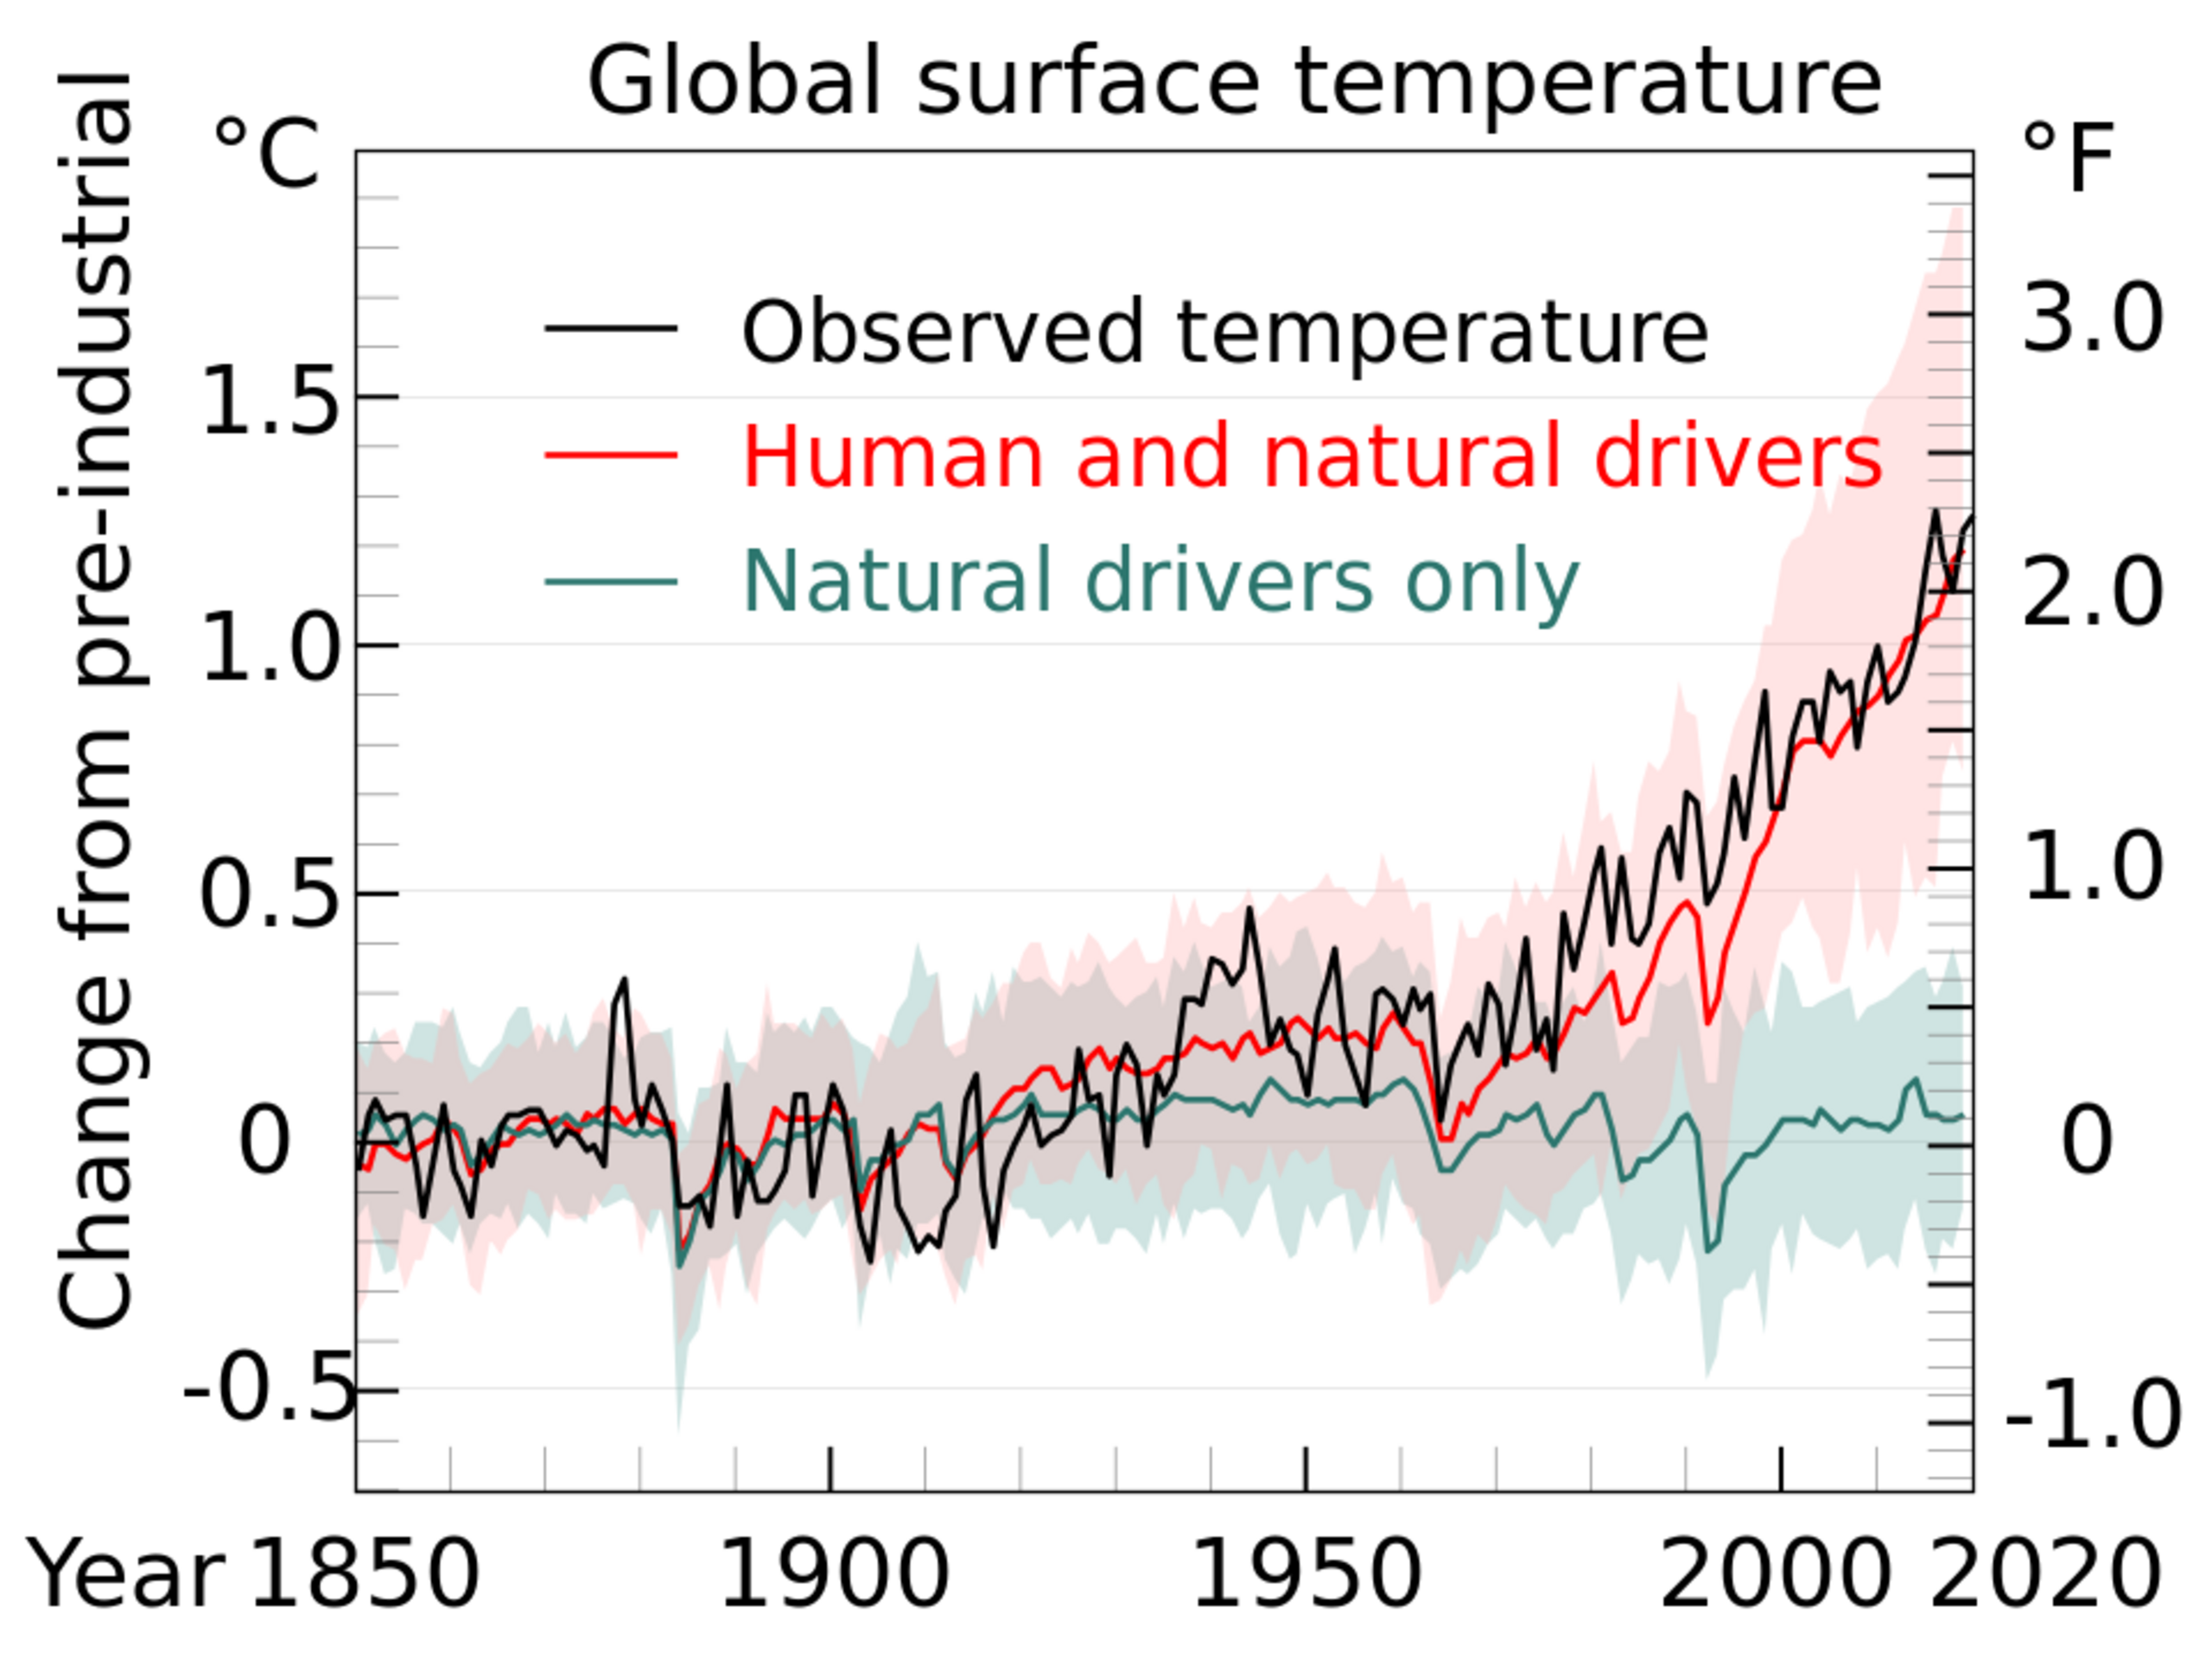
Changes in global surface temperature over the past 170 years (black line) relative to 1850–1900 and annually averaged, compared to CMIP6 climate model simulations of the temperature response to both human and natural drivers (red), and to only natural drivers (solar and volcanic activity, green). Solid colored lines show the multi-model average, and colored shades show the range ("very likely") of simulations . Source: IPCC AR6 WGI, Figure SPM.1b, p. SPM-7. See Global Temperature And Forces.svg for a version without Fahrenheit.
Licensing

This work is licensed under the Creative Commons Attribution ShareAlike 4.0 International license.
The author of the work is {{{author}}} and the work was originally released [{{{source}}} here].
File history
Click on a date/time to view the file as it appeared at that time.
| Date/Time | Thumbnail | Dimensions | User | Comment | |
|---|---|---|---|---|---|
| current | 09:13, 6 January 2023 | | 960 × 720 (51 KB) | Paula (talk | contribs) | Changes in global surface temperature over the past 170 years (black line) relative to 1850–1900 and annually averaged, compared to CMIP6 climate model simulations of the temperature response to both human and natural drivers (red), and to only natural drivers (solar and volcanic activity, green). Solid colored lines show the multi-model average, and colored shades show the range ("very likely") of simulations . Source: IPCC AR6 WGI, Figure SPM.1b, p. SPM-7. See Global Temperature And Forces.... |
You cannot overwrite this file.
File usage
The following 7 pages use this file: